What is a Cause and Effect (Fishbone) Diagram?
Estimated reading time: 5 minutes
Organizations use quality tools to help solve problems. One of those tools is called a Cause and Effect Diagram.
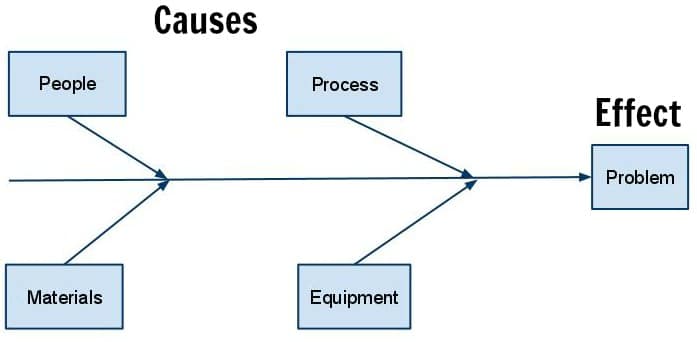
A cause and effect diagram, also known as a fishbone diagram, helps a team identify the different causes of a problem to determine the root causes of a problem.
Using a fishbone diagram allows a team to focus on the problem instead of the issues associated with the problem.
It challenges the team members to explore the causes rather than the specific symptoms.
For example, if a mortgage company is experiencing an increased number of customer complaints, this process would help determine what it is that is driving the complaints and not focus so much on the process of dealing with complaining customers.
Identifying the root causes can shed light on improvement opportunities for systems and processes that touch the problem.
So, How Do You Create A Fishbone Diagram?
1. Pick A Team
The first step is coming up with a team of people who are familiar with and in some capacity, touch the problem.
The more diverse the team, the better problem-solving will happen.
Many teams make the mistake of only using people who are in decision-making capacity and neglect the front-line people who have a working knowledge of what drives problems.

For instance, in the example of a mortgage company, a team might include customer support staff, mortgage processors, sales personnel, loan underwriters, and loan closers.
A team of 5 to 7 people is ideal. Too few people are not representative, and too many people are difficult to facilitate.
Obviously, the nature of the problem also should dictate how many of the right people should be on the team.
2. Create A Problem Statement
The next step is to have the team articulate a problem statement that reflects the identified issue.
A well-written problem statement will ensure everyone on the team is on the same page and will answer the question, “what is the problem that we need to solve?”
The problem statement will become the “head” of the fish.
For instance, in the above example, a problem statement might be something like this: Mortgage application to close process is too long (90 days).
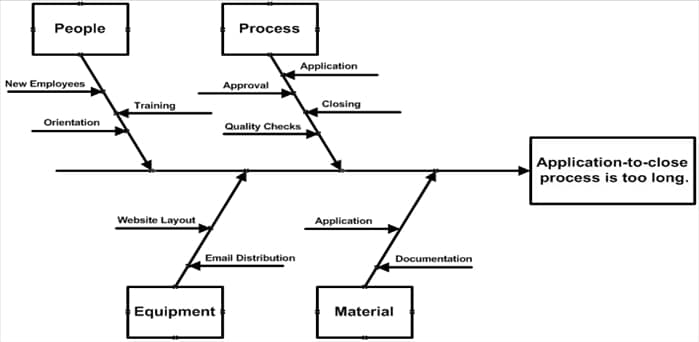
Example Cause And Effect (Fish Bone) Diagram

3. Brainstorm The Causes Of The Problem
The causes of problems are not always obvious so a team will need to figure out what is causing the problem. There are a couple of different methods you can use for this step.
One option is to gather information and use available data to identify the causes of the problem.
For instance, tracking the application process and studying the average time it takes to close.
Another method can be simple brainstorming.
This is done by having the team throw ideas on a flipchart or whiteboard and then group the thoughts by cause category.
Go around the room and ask participants to share ideas based on their experience with the process.
For instance, an underwriter may identify incomplete applications as part of the hold up in processing.
In this example, the cause categories are people, processes, materials, and equipment.
These are pretty standard categories, but the categories may be different depending on the problem to be solved.
4. Construct The Diagram
After all of the causes of the problem have been identified and grouped by category, the next step is to take all of the identified causes and put them on the spine of the fish.
As you add them, you will see the diagram take shape.
As an example: Let’s say you operate a mortgage company, and because of an influx in mortgage applications, due to low-interest rates, the application-to-close process has gone from 10 days to 3 months.
Problem Statement: The application-to-close process is too long.
Problem Causes:
People: New Employees, Training, Orientation
Process: Application, Approval, Closing Process, Quality Checks
Materials: Application, Supporting Documentation
Equipment: Website Layout, Email Distribution,

5. Drill Down on Causes
The next step is to drill down on the causes and identify any opportunities that can be developed into an improvement plan.
Develop a plan and assign accountability (who) and timelines (when) to tasks associated with improvements.
For example, drilling down on the new employee orientation process may shed light on more issues and opportunities for improvements to how new staff are prepared for job responsibilities.
6. Implement Improvement Plans and Check Results
Implement the plans and check to see if improvements worked.
It is not unusual for teams to use a couple of different improvement ideas to affect positive change.
Keep refining and testing until the problem as written is corrected.
Maintain the team until the group agrees the problem has been successfully eliminated.
Cause and effect diagrams benefit teams by taking advantage of the collective knowledge of a workgroup.
Use Microsoft Office Visio or Google Docs to create a Fishbone Diagram and hang it in a common work area for all employees to see.
This exercise with not only help to solve work process problems but it will also act as a team-building exercise and will help facilitate a culture where employees are engaged because they are included in the problem-solving process.


